This article was written by Stanislav Bernukhov, Senior Trading Content Specialist
The beginning of October was relatively calm in financial markets despite expected growth fluctuations. The release of the Non-Farm Payrolls report was delayed due to the US government shutdown, so volatility was smoothed across the board, with the only significant economic driver published being the US Services PMI, which was slightly lower than expected (50 instead of 51), but still indicating a positive development.
Despite the absence of official data from the US labor market, investors are maintaining somewhat positive sentiment as private sector indicators show employment and new payrolls strengthening, rather than growing or declining. This did not boost volatility, and markets generally maintained momentum, with the S&P 500 closing the week in the green. Bitcoin rose and hit a new all-time high at around $125,000, while crude oil fell to nearly $60.
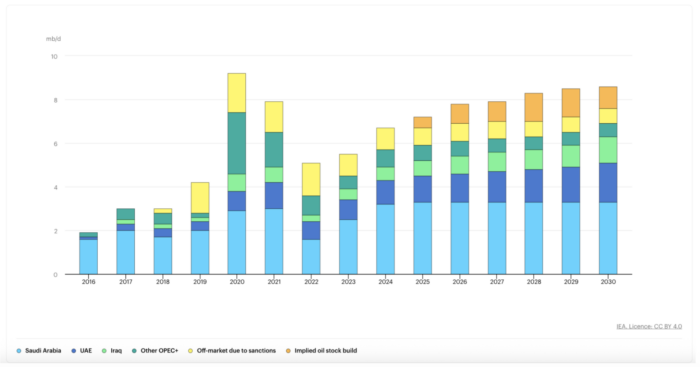
The new decision of OPEC+ on Sunday, October 5 was to increase production modestly, which may be considered a weak result for crude oil, as one option was to increase it twice from the current level. This remains a negative factor, along with recent developments regarding talks between Hamas and Israel in Egypt.

US President Donald Trump’s public warning to Hamas sent markets into a tailspin, with the Nasdaq closing the day in red, and the VIX index rising above 16, which is still quite far from any real volatility. Crude oil futures remained in a downward trend despite all the worrying factors.
Traders will be looking forward to the end of the government shutdown this week and news from talks between Israel and Hamas.
Among important economic releases, traders will look forward to the release of the Federal Open Market Committee meeting minutes on Wednesday and the Michigan Consumer Confidence Index on Friday.
Now, let’s review the fundamental scenarios for crude oil and the S&P 500 for next week.
USOIL
Crude oil is moving lower accelerating momentum near the bottom of the 20-day Bollinger Band. The next potential support will be around the $59-60 area, as a break above the $60 area could trigger some short selling and liquidation of leveraged long positions.
As the market enters a highly volatile seasonal period, we may notice wide swings in both directions after achieving the aforementioned goal.

USOIL, daily chart: Source, Exness.com
Standard & Poor’s 500
The S&P500 is positioned above the upper line of the Bollinger Bands indicator (20), showing weak momentum. Market breadth is slowly decreasing, as the technology sector came under pressure on Friday. This may be a normal sector rotation mechanism within a bull market, or a precursor to a broader correction.
However, the uptrend may continue, but upside breakouts may be vulnerable to profit taking and corrections as the upside reaches a plateau.
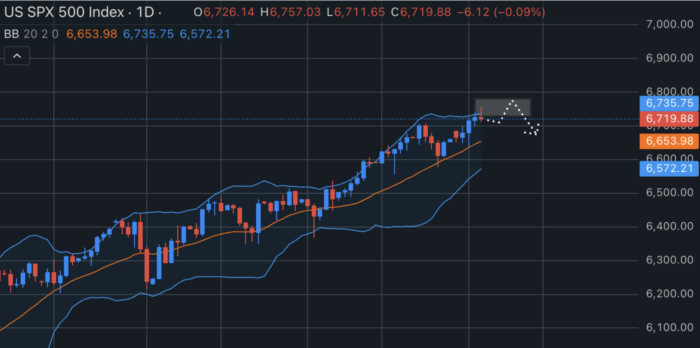
US500. Source: Exness website