Written by the head of the FP Markets Aaron Hill
The news of the first page this morning focused on the ceasefire between Israel and Iran, which US President Donald Trump announced for the first time on his social platform. However, recent reports on fire rockets appeared in Iran, and it appears to be violating the ceasefire, but no confirmation has been received yet. The important point is that things remain somewhat unconfirmed from writing.
The technical front, however, is interesting on WTI Oil (West Texas Medium), and eventually indicates a moderate decline before heading down.

A monthly descending triangle in play
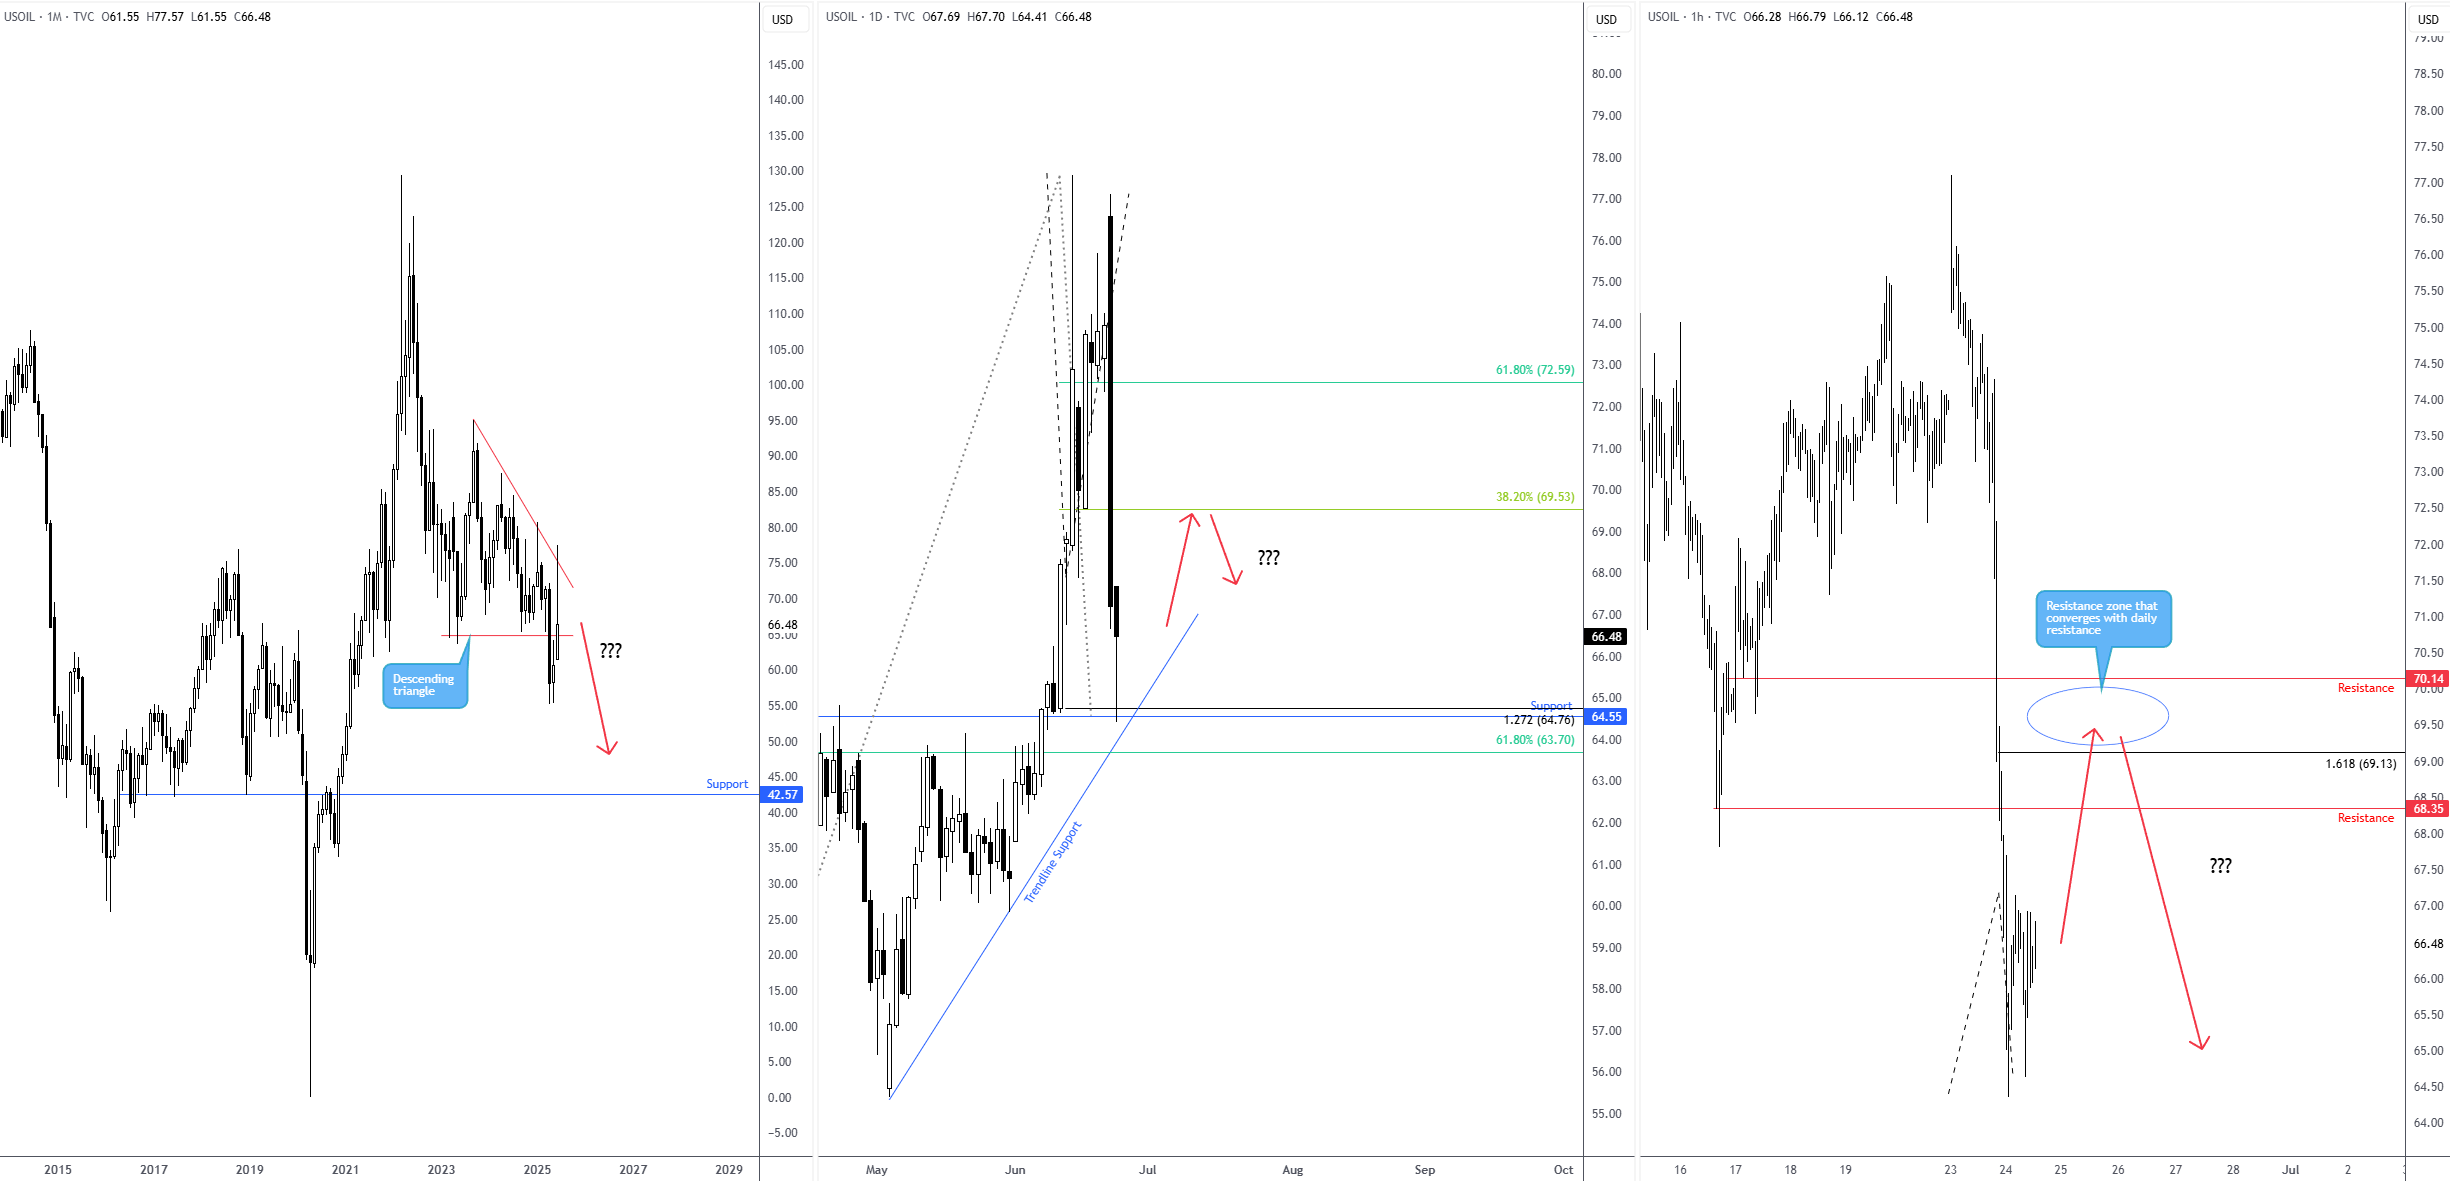
The flow on the monthly graph reveals that the price movement complete A descending triangle in April of this year, consisting between $ 95.00 and $ 64.41. After violating the minimum and fresh borders from one year to the date of (YTD) from $ 55.15, a specific decline was embodied and led to the unit test the upper barrier of the pattern. As you can see, the test was conducted at the present time, as June is ready to end the month to a large extent of its best levels.
Given that the price has strongly rejected the upper border to form the triangle, and if we see WTI to its lowest fresh levels, this would discover a possible scenario in the direction of support from $ 42.57.
Fibonacci daily resistance
Through the page on the daily chart, you will notice that the last flow did not touch the gloves with the support of 64.55 USD, a level completed by the Fibonacci projection rate of 1.272 % at 64.76 USD, and the direction line support (extended from a decrease in the level of $ 55.40), and 61.8 % of the level of Fibonacci adjacent at 63.7. Given that the drop -off rate of 1.272 % also represents a “alternative” support pattern AB = CD, traders with a length of $ 64.55 may aim to 38.2 % and 61.8 % of the rates modified in Fibonacci of $ 69.53 and $ 72.59. Thus, both these lines are possible levels of resistance to viewing.
H1 Convergence
With a monthly price indicating more selling and daily resistance on the table, the H1 chart lights up on two levels of resistance at $ 68.35 and $ 70.14. However, I am more attracted to the last level as a possible resistance. This is because it is closely close to the rate of Fibonacci by 38.2 % on the daily time frame mentioned above at a price of $ 69.53, in addition to the nearly 1.618 % Fibonacci projection rate on the H1 chart at 69.13 USD.
As a result, my focus on H1 resistance will be between $ 70.14 and $ 69.13.